Executive Summary
Venn diagrams were developed by the logician John Venn. They represent an easy way to identify structures or relationships among organisations and how they are perceived in a community. Venn diagrams can be useful tools for analysis or support the decision making process in a sanitation and water management intervention.
Introduction
The concept of the Venn diagram was surveyed by John Venn, as the name of the diagram suggests. He introduced the diagram in 1880, and since then, the Venn diagram became very popular because it is very easy to understand and to use (RUSKEY & WESTON 2005). Sometimes, the Venn diagram is also called Chapati diagram (Chapatis are a round, flat type of bread eaten in India and South Asia).
Use and Applications of Venn Diagrams
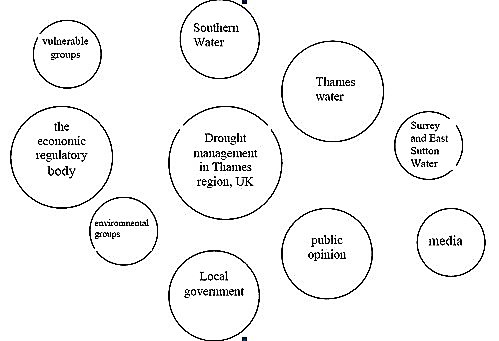
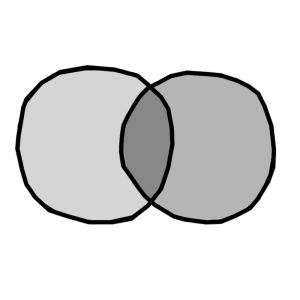
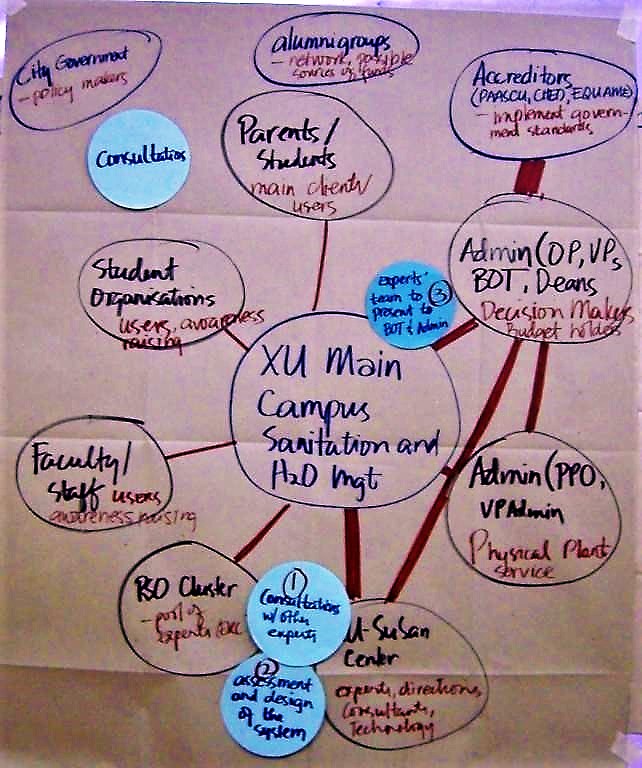
This use of the Venn diagrams can be very helpful for organisations because it allows the illustration of the extent to which individuals, organisations or projects interact with each other or overlap. By the size of the circle, you can show the importance of an organisation or projects. The bigger a circle is, the more important is a project. The proximity of the circles illustrates how much interaction between the players is ongoing. Overlapping circles represent interacting organisations (see stakeholder analysis starting by stakeholder identification factsheet). There is also the possibility of a subset. This means that a small circle is placed within a larger circle. The small circle stands for a component in a big organisation or project which is symbolised by a big circle. If there are several groups which draw Venn diagrams on the same topic, it could be useful to combine or compare the different diagrams (see also group works). A discussion allows to see differences or similarities in perception, as mentioned above. A further discussion could lead to conflict resolution or organisational capacity building (MSP n.y.).
Steps to Create a Venn Diagram
(Adapted from UT 2006)
The Venn diagram can be used in many different ways, so this guidance has to be contemplated as a general one.
- Individually or in a group, define a “central figure”.
- As the participants draw the diagram, the size of the circle can equal the importance or physical size of the institution; a larger circle is more important than a smaller circle.
- The closeness between circles indicates the strength of interactions. An intersection of circles means a strong relationship between the organisations.
- Possible lines between circles can also show the frequency of contact or the importance of the institutions/organisations.
There are many more possible applications of Venn diagrams. It can help to find out how major institutions or organisations are perceived in a community (UT 2006). It can be used to develop a social map which shows the social structure (FAO 2003). There is also the possibility of classify things after certain criteria (see also problem tree analysis).
The Venn diagrams can be extremely helpful if you want to explore the relative importance of different influences on a process. It also helps you to prepare a map that show a particular organisation locates itself in relation to others or to a social community (CANERGIEUKTRUST 2010). But a use of many circles is going to be complicated because the growing complexity of intersecting or linking the circles makes it difficult to draw them accurately (RUSKEY & WESTON 2005).
Democracy & Civil Society Programme
Marketing information systems for non-timber forest products
Multi-Stakeholder Processes and Social Learning
Stakeholder Engagement
A Survey of Venn Diagrams
Visual techniques
A document about how to find out information from people individually or in group settings. This can be done with Venn diagrams but other techniques can also be applied.
UT (2006): Visual techniques. Texas: Southwestern Medical Center, University of Texas System. [Accessed: 09.09.2010] PDFSystem Diagram – Guidelines
A document that deals with the use of diagrams. This includes not only Venn diagrams but also other types of diagram. The file first it gives an introduction to the type of diagram, then some instructions on how to use them. At the end, an example is presented.
HAWKINS, R. (n.y): System Diagram – Guidelines. Wageningen: International Centre for development oriented Research in Agriculture (ICRA) URL [Accessed: 07.07.2019]Visual techniques
A document about how to find out information from people individually or in group settings. This can be done with Venn diagrams but other techniques can also be applied.
UT (2006): Visual techniques. Texas: Southwestern Medical Center, University of Texas System. [Accessed: 09.09.2010] PDFField Training Guide, Training Manuals for HIV/AIDS Committees at Local Government Authorities
An example how the Venn diagrams can be used in the field. In this specific case, it is used to collect data about relationships between social groups/ NGO’s and their importance to fight HIV/AIDS (see page 30-32).
EVAPLAN (2004): Field Training Guide, Training Manuals for HIV/AIDS Committees at Local Government Authorities. Evaplan GmbH, University Hospital Heidelberg. [Accessed: 13.09.2010] PDFMusing on the use of chapati diagrams
A concrete example about the use of Venn diagrams and what they can detect. The use of Venn diagram is simple, but it is not without any problems as this example shows.
FARNWORTH, C.R. (1998): Musing on the use of chapati diagrams. In: PLA Notes 1998: Volume 31 , 9-12. URL [Accessed: 07.07.2019]Marketing information systems for non-timber forest products
This very short example illustrates the use of a Venn diagram to show the social structure in a village.